Fill out this form, and we will get in touch with you.
Your form has been successfully submitted. Our team will be in touch with you shortly.
Oops! Something went wrong while submitting the form.
Your Guide to a Return On Ad Spend Calculator
Boost campaign profits with our simple return on ad spend calculator. Learn the ROAS formula, how to calculate it, and strategies to improve your results today.
Nitin Mahajan
Founder & CEO
Published on
November 8, 2025
Read Time
🕧
3 min
November 8, 2025
Values that Define us
Ever wonder if your ad campaigns are actually making you money or just eating up your budget? That's where a Return on Ad Spend (ROAS) calculator comes in. It’s a simple but powerful tool that tells you exactly how much revenue you’re earning for every dollar you put into advertising.
What Is a Return On Ad Spend Calculator
Think of a ROAS calculator as a financial reality check for your marketing. It cuts through the noise of vanity metrics like clicks and impressions to focus on the one thing that truly impacts your business: profit.
All you have to do is plug in two numbers—your total ad cost and the total revenue generated from that spend. The calculator instantly gives you a ratio that spells out your campaign's financial performance in black and white.
Let's say you spent $1,000 on a Google Ads campaign that brought in $4,000 in sales. Your ROAS would be 4:1. It's that simple. For every single dollar you invested, you got four dollars back. This kind of clarity is crucial for making smart, data-backed decisions about where your marketing dollars should go next.
Why This Simple Metric Matters
Honestly, understanding your ROAS is a game-changer for effective advertising. It gives you a clear, consistent way to measure the success of different campaigns, channels, or even specific ad creatives. Without it, you're flying blind, just guessing which parts of your strategy are actually pulling their weight.
Keeping an eye on this metric helps you:
Pinpoint Your Winning Channels: Is your investment in Meta ads delivering more bang for your buck than your TikTok campaigns? ROAS will tell you.
Refine Your Ad Creative: You can compare the ROAS of different ad versions to see which images and headlines truly connect with your audience and drive sales.
Justify Your Marketing Budget: When you can show stakeholders clear financial proof that your ads are generating a solid return, those budget conversations get a whole lot easier.
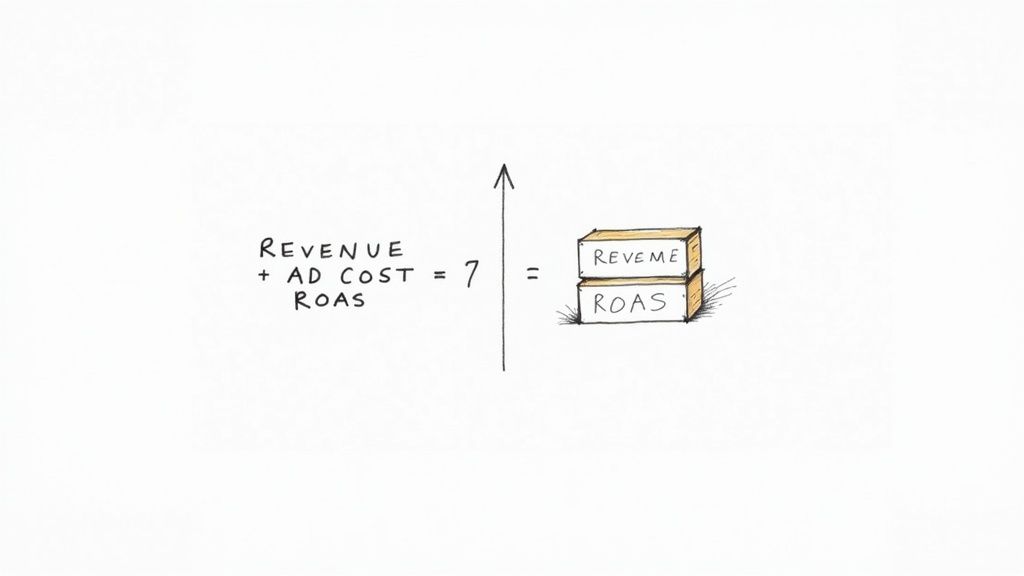
The formula itself is straightforward: you just divide the total revenue from a campaign by its total cost. For example, if an ad campaign costs $100 and brings in $200 of revenue, the ROAS is 2.0, or 200%. This basic calculation is a foundational piece of modern advertising, which you can learn more about in our guide on what is performance marketing.
By consistently tracking ROAS, you shift from just spending money on ads to strategically investing it. It’s how you turn your marketing department from a cost center into a predictable revenue-generating engine for your business.
Getting an Accurate ROAS Calculation
If you want a ROAS figure you can actually trust, you have to look beyond just the surface-level numbers. Getting this right means digging into what really goes into your ad costs and what revenue can be directly tied back to your campaigns.
The most common trap marketers fall into is only looking at their ad spend—the money paid directly to platforms like Google or Meta. But your total ad cost is so much more than that. It needs to account for every single dollar that supports those campaigns.
You'd be surprised how quickly the hidden costs add up. Make sure you're including:
Partner and Agency Fees: If you're working with a marketing agency or freelancers, their fees are a direct cost of running your ads.
Software and Tool Subscriptions: Think about your analytics tools, design software (like Canva or Adobe), or any special platforms you use for campaign management. Those costs count.
Creative and Production Costs: Did you hire a designer for your ad creative? A videographer for a video ad? That’s all part of the investment.
Factoring in these expenses gives you the true cost of your advertising. For a really detailed breakdown with more examples, check out this guide on how to calculate your Return on Ad Spend (ROAS).
Nailing Down Your Total Revenue
Now for the other side of the equation: revenue. It’s crucial to accurately track the sales that came directly from your ads. If you’re an e-commerce brand, this means having your tracking pixels and UTM parameters set up perfectly to trace every purchase back to the specific ad that brought the customer in.
Let's walk through a simple, real-world example. Say you spent $500 on a campaign, and it brought in $1,000 in sales. Your ROAS would be 2.0x (or 200%). In simple terms, this tells you that for every dollar you spent, you made two dollars back. Half of your revenue covered the ad spend, and the other half is your return.
When you meticulously track both your full costs and the revenue that’s directly attributable to your ads, you get a ROAS figure that means something. It stops being just another metric and becomes a clear, reliable indicator of whether your advertising is actually making money.
While ROAS is fantastic for judging specific campaigns, it's also smart to keep an eye on the bigger picture. Understanding how to calculate marketing ROI will give you that broader perspective on how all your marketing efforts are performing together.
Understanding What a Good ROAS Looks Like
So you've used a return on ad spend calculator and have a number. Now what? The million-dollar question is always, "Is this ROAS any good?"
Honestly, there's no magic number that works for everyone. A fantastic ROAS for one business could spell disaster for another. It all comes down to your specific business model.
The biggest factor? Your profit margins. If you're selling a high-margin product like a digital course, a 3:1 ROAS might be wildly profitable. But if you’re in e-commerce with razor-thin margins on physical goods, you might need something closer to an 8:1 ROAS just to break even after you factor in the cost of goods sold and other overhead.
Setting Realistic Benchmarks
Your campaign goals also completely change the definition of "good." A campaign designed purely for brand awareness will naturally have a lower ROAS, and that’s okay. It’s playing the long game. On the other hand, a direct-response campaign pushing for immediate sales needs a much higher return to justify its existence.
Key Takeaway: Stop chasing a universal "good" ROAS. Instead, get laser-focused on your break-even ROAS. This is the minimum you need to make back to cover your ad spend and product costs. Anything above that is pure profit.
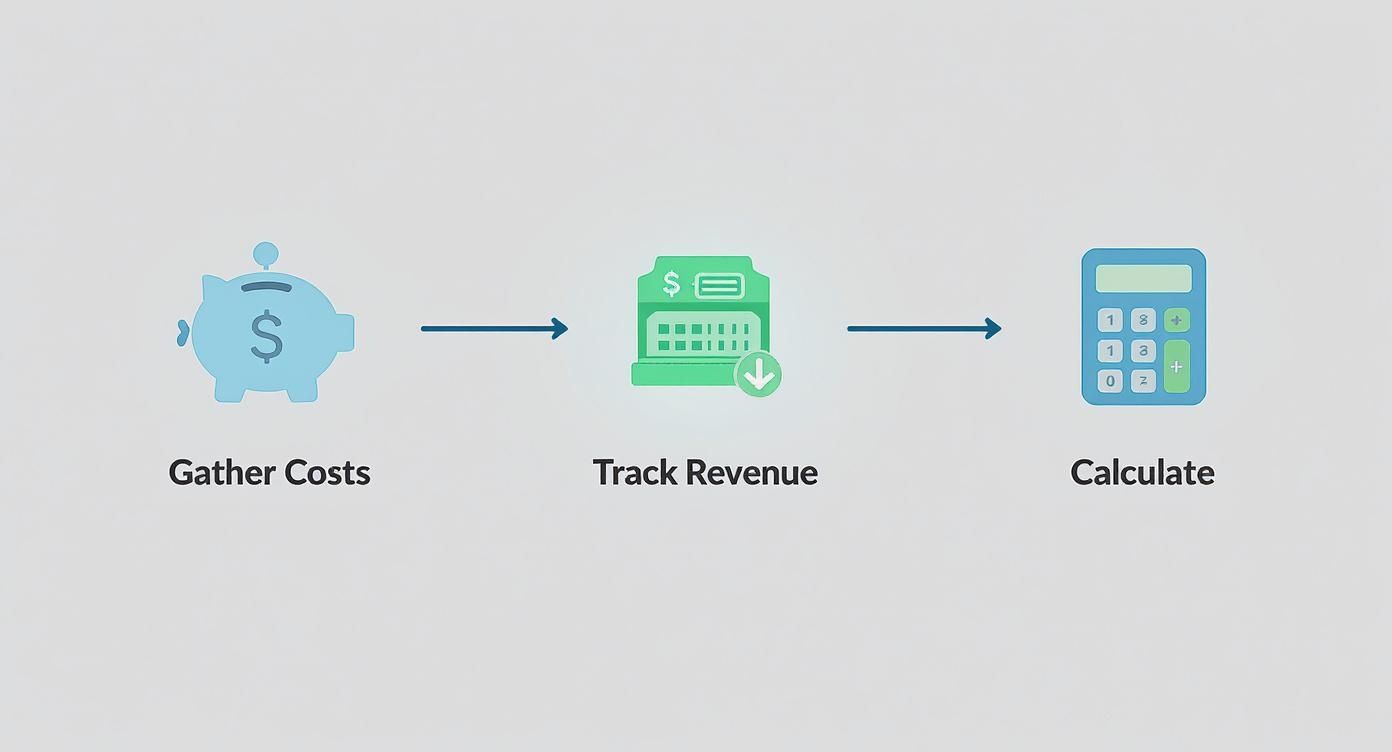
The whole process starts with diligent tracking. You need to know your costs and revenue inside and out before you can even think about calculating a meaningful ROAS.
This infographic lays out the basic flow.
As you can see, getting a solid number isn't just about plugging figures into a formula. It starts with accurately gathering your cost data and connecting it to the revenue it generated.
Average ROAS Benchmarks by Industry and Platform
While your own numbers are what matter most, it can be helpful to see how you stack up against the competition. Industry and platform benchmarks give you a general frame of reference.
This table provides a general overview of typical Return On Ad Spend (ROAS) ratios across various industries and popular advertising platforms.
Industry / Platform
Average ROAS (Ratio)
E-commerce (Overall)
4:1
B2B Services
5:1
Legal
3.5:1
Retail
4.5:1
Google Ads (Search)
4:1
Meta Ads (Facebook/IG)
5:1
Amazon Ads
6:1
TikTok Ads
3:1
Keep in mind, these are just averages. A "good" ROAS still comes back to your own business's health and profitability goals. For many digital platforms, a general benchmark often falls between 3:1 and 5:1. This means you're generating $3 to $5 in revenue for every dollar you spend on ads. To get a deeper dive, you can explore more detailed industry benchmarks and see how you compare.
Proven Strategies to Improve Your ROAS
Knowing your ROAS is one thing, but improving it is where you start to see real growth. This comes down to making smarter, more targeted decisions that boost revenue while keeping costs in check.
A great place to start is by getting serious about who sees your ads. Many businesses waste money by casting too wide a net. You have to dive into your analytics, pinpoint your most profitable customer segments, and then double down on your budget for them.
Think of a SaaS company that initially targeted all small businesses. By digging into their data, they might discover their best ROAS comes from healthcare practices. Creating a dedicated LinkedIn campaign that speaks directly to that audience could easily double their return just by focusing their efforts.
Fine-Tune Your Campaigns
Once your targeting is dialed in, it’s time to look at the campaigns themselves. Strong ad copy and eye-catching visuals are your first hurdle, but getting that click is only half the battle.
A/B Test Everything: Stop guessing what works. Constantly test different headlines, images, and calls-to-action to find what truly resonates. A tiny tweak can sometimes lead to a surprising lift in conversions.
Optimize Your Landing Pages: Your landing page must deliver on the promise your ad made. Make sure it loads fast, looks great on mobile, and gives visitors a clear path to take action. Applying solid conversion rate optimization tips is a non-negotiable step.
Refine Your Bidding: How you bid directly impacts your ad cost, making it a critical lever for profitability. To get a better handle on this, check out our guide on effective Google Ads bidding strategies.
By systematically improving each piece of the puzzle—from the audience and creative to the post-click experience—you create a more efficient advertising machine. Each optimization builds on the last, leading to a stronger ROAS.
Watch Out for These Common ROAS Calculation Mistakes
Getting your ROAS calculation wrong can lead to bad marketing decisions. To make sure the number you’re looking at is the real deal, steer clear of a few common pitfalls.
Are You Factoring in All the Costs?
One of the biggest blunders is forgetting about the "soft costs." Your total ad spend is more than just the check you write to Google or Meta. What about your agency's monthly retainer? The subscription fee for your design software? The cost of hiring a freelancer?
If you ignore these expenses, your ROAS will look artificially high. It’s easy to think a campaign is crushing it when its true profitability is much lower.
Is Your Attribution Accurate?
Another classic mistake is messy revenue attribution. If your tracking isn't dialed in, you could easily give an ad campaign credit for a sale that really came from an email newsletter or an organic search. This kind of mix-up completely skews your data.
Thinking Beyond the First Sale
It’s also incredibly important to look past the initial purchase. A new customer's first order is just one piece of a much larger puzzle.
A campaign might show a low ROAS at first glance, but if it's bringing in customers who stick around and buy again, its true value is much higher. Focusing only on that first transaction might lead you to kill a campaign that's building long-term profit.
By sidestepping these key mistakes, the data from your return on ad spend calculator will give you a clear, honest picture of your campaign's performance. That's how you make smarter, more strategic calls that actually grow your business.
Got Questions About ROAS? We've Got Answers.
Even after you get the hang of it, a few common questions always seem to surface when people start digging into their return on ad spend. Let's tackle some of the ones I hear most often.
ROAS vs. ROI: Aren't They the Same Thing?
Nope, and this is a really important distinction. Think of ROAS as a focused, tactical metric. It tells you the gross revenue you're generating from a specific ad campaign. It's all about how hard your ad dollars are working.
Return on Investment (ROI), on the other hand, is the big-picture business metric. It looks at the total profit from an investment after you've subtracted all the costs involved—not just the ad spend. ROI measures overall business health, while ROAS zooms in on ad performance.
How Often Should I Actually Be Checking My ROAS?
This really depends on the speed and length of your campaign. For a high-intensity, short-term push like a weekend flash sale, you'll probably want to check your ROAS daily.
For longer, always-on campaigns, checking weekly or bi-weekly is usually plenty. This gives you enough data to see real trends without getting jumpy over small, daily ups and downs.
The most important thing is to be consistent. Pick a schedule that makes sense for your reporting and stick with it. That’s how you’ll spot meaningful patterns and make smart adjustments.
Is it Possible for a High ROAS to be Unprofitable?
Yes, 100%. This is a classic trap, and it all comes down to your profit margins.
Let's say you're celebrating a fantastic 8:1 ROAS. That feels like a huge win—you're making $8 for every $1 you spend on ads! But what if the total cost to produce, pack, and ship that product is $7.50? You're only actually pocketing $0.50 in profit.
That great-looking ROAS isn't so great anymore. You always have to look at your ROAS next to your actual profit margins to see what’s really happening with your money.
Ready to stop guessing and start making data-driven decisions? Let BrandBooster.ai help you build and execute marketing strategies that deliver real returns. We guarantee results in 60 days, or you don't pay. Learn more at BrandBooster.ai.
By clicking "Accept all cookies", you agree to storing cookies on your device to enhance site navigation, analyze site usage and assist in our marketing efforts as outlined in our Privacy Policy.
By clicking 'Accept all cookies', you agree to storing cookies on your device to enhance site navigation, analyze site usage and assist in our marketing efforts as outlined in our Privacy Policy.